By
Cortechs.ai
2 mins
CorTech’s Labs expands the capabilities of LesionQuant, the leading quantitative application for assessing demyelinating diseases. New functionality provides improved identification of lesions and the ability to monitor new, active and resolving lesions as well as disease progression.
Physicians receive comprehensive FLAIR lesion and brain structure volumetric reports, along with visualized lesion and lesion volume change overlays for better diagnosis and disease monitoring.
The latest release provides improvements based on user feedback received from physicians in the field. These new features allow customized calibration and expanded lesion detection settings, novel lesion change overlays, additional DICOM output options, monitoring of new, active and resolving lesions, and reorganized reports for ease of interpretation.
“Expanding the LesionQuant configurable options with version 3.0 empowers physicians by allowing personalized threshold settings instead of a standard approach,” says Cortechs.ai’ clinical specialist Micki Maes. “Users can now configure smaller minimum lesion size and define the lesion detection sensitivity per region to improve lesion detection.”
Expanded User Defined Lesion Calibration
Lower Minimum Lesion Size Threshold
Detection of smaller lesions is now possible, allowing for a more detailed assessment. The Minimum Lesion size setting now has a range of 1 to 64 mm3 to suit your personal diagnostic needs. Note that longitudinal tracking of lesion change requires a consistent setting.
Lesion Separation
By default, LesionQuant labels lesions as separate when the distance between them is greater than one voxel, or about 1 mm. This lesion separation threshold can be increased by 1 mm increments, with a range of 1-5 mm. The lesion separation setting must also remain constant for longitudinal tracking of lesion change.
Lesion Detection Thresholds
LesionQuant detects lesions as regions that appear substantially brighter than the surrounding white matter or gray matter on a T2 FLAIR image. A corresponding hypointensity on a T1 image is also expected. Lesion detection thresholds can be used to adjust the minimum relative brightness differential required for lesion detection. We have added this feature to help customers who have problems with scanner protocols affecting their image quality or use different lesion definitions in their practice.
Detection thresholds follow the McDonald Criteria for dissemination in space and can be set separately for leukocortical, periventricular, infratentorial and deep white matter regions. The user can configure thresholds for each region over an artificial range 0-2 (1 is the default value). Lowering a threshold for a region below 1 increases the detection sensitivity, while increasing it lowers the sensitivity (i.e. 0 is the most sensitive setting allowing potentially for more lesions to be detected, but also increasing the risk of false positives and 2 is the least sensitive setting, allowing potentially for fewer false positives, but also for increasing the risk of missing lesions).
The default threshold setting for all regions is 1 and should be optimal for the majority of users. We do not recommend changing the thresholds from their default values, without first consulting our technical support team.
Volumetric Report Changes
Single Time Point Report Changes
Streamlined LesionQuant reports for single time point analysis are designed for quick and easy interpretation.
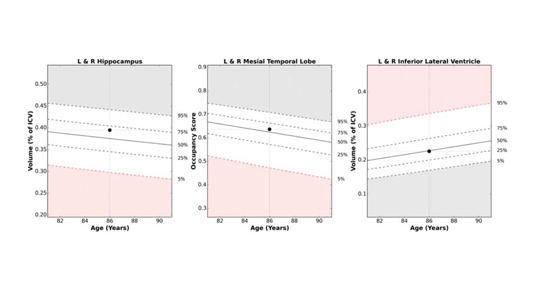
- All age and sex-matched reference charts are now displayed on page two for a quick review and all empty cells have been removed from page one.
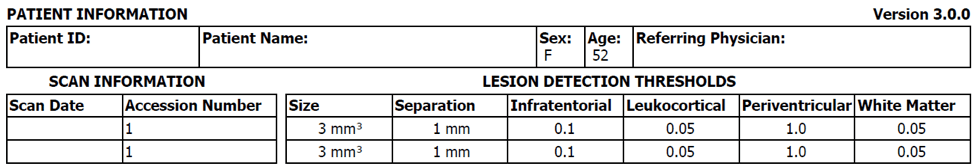
- We’ve also added lesion detection threshold values to the top of page one to ensure consistent and accurate analysis.
Multi-Time-Point Report Changes
The longitudinal LesionQuant change report has similarly been streamlined and summarized to allow for quicker and easier interpretation.
-
-
- Lesion Detection Thresholds
-
Beginning at the top of the report you will now see the settings you selected for the lesion detection thresholds for each time point. This is a great way to ensure that the settings are consistent between time points, thus ensuring accurate change analysis.
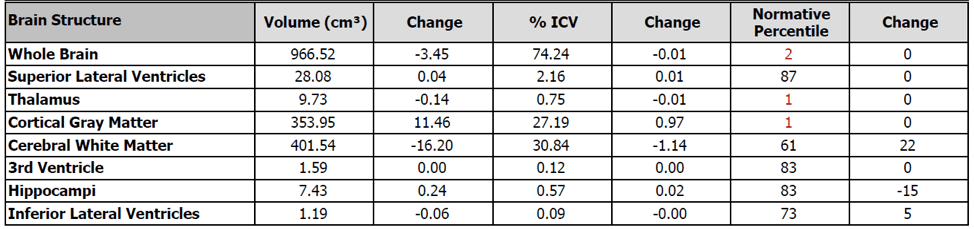
2. Morphometry Results and Change Values (if applicable)
The morphometry results section contains 8 different brain structures that are often relevant to multiple sclerosis and disability progression. This table presents structures’ volumes in cm3, as percentages of the total intracranial volume, and their normative percentiles.
You will also see the observed change value for each column to the right. You can use these volumetric results to monitor overall atrophy progression, to determine whether the patient is at risk for progressing on the EDSS disability scale, and more.
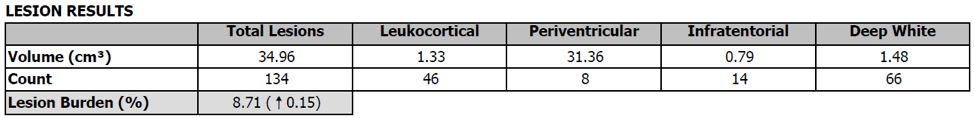
3. Lesion Results
The lesion results section shows the total lesion volume (cm3) and counts in the anatomical regions.
The lesion burden now indicates the change in the ratio of the total lesion volume to the white matter volume as a percentage with an arrow indicating an increase (up) or decrease (down).
4. NEW: Lesion Dynamics
A new lesion dynamics table shows the change in the total lesion volumes and counts between the two time points. The count of lesions that are new, active, or resolving is displayed with the corresponding volume change alongside (in parentheses).
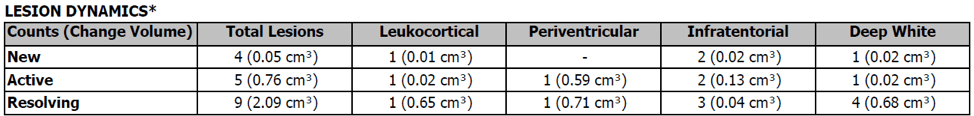
5. NEW: Resolving Lesions
In addition to providing the count and volume of new and active lesions, users will now see the count and volume of resolving lesions. This information can be used to assess a patient’s response to a particular treatment and to monitor the disease progression.
New lesions are defined as those that are not overlapping in the same location with any lesions in a previous scan, active lesions are those that overall substantially (over 2% of the lesion volume affected) increased in brightness and/or increased in size from a previous scan. Resolving lesions are defined as those that overall substantially (over 2% of the lesion volume affected) diminished in brightness and/or decreased in size compared to overlapping lesions in a previous scan. Note that for confluent lesions labeling may not always be easy to determine as in the case of isolated lesions.
6. NEW: Lesion Change Summary
An exciting addition to the report is the lesion change summary.
The summary includes a standardized description of the current total lesion volume, count, and lesion burden change as well as the location and count of new, active, and resolving lesions, and the net effect.
This summary makes it easy to translate the numerical report data into a verbal dictation. You can also import this information into a report using PowerScribe dictation software.
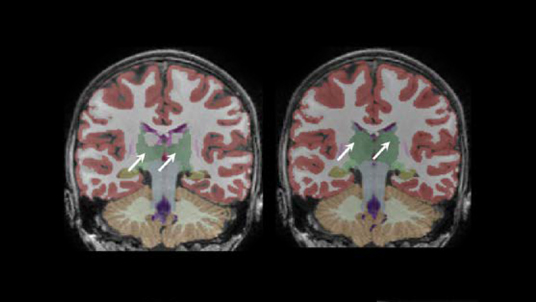
7. NEW: Lesion Change Overlays
LesionQuant now also provides a color overlay to visualize lesion change.
These overlays take longitudinal lesion analysis to the next level by providing a color-coded heatmap of lesion changes, also identifying lesions as new, active (enlarging and/or increasing in intensity, affecting over 2% of the lesion), stable (no net change exceeding 2% of the lesion), or resolving (shrinking or dimming lesions, affecting over 2% of the lesion).
You will be able to see exactly where changes are occurring in the brain and within each lesion and the overall effect on each lesion.
The original LesionQuant change output is still available as the LQChange series. The original visualization shows all changes in the brain and may include changes not associated with segmented lesions.
8. NEW: Brain Segmentation
LesionQuant now provides an updated brain segmentation volume (similar to NeuroQuant) as an optional output.
The output is similar to the NeuroQuant segmentation, however, it includes LesionQuant’s T2 FLAIR segmented lesions.
Important Considerations
- Lesions can become confluent or disjointed over time and this may affect the regional counts and change category (as new, active, stable, or resolving).
- Large confluent lesions often change over time (portions may become more active, or portions may dim), yet only the net change is considered for labeling the entire lesion (as active, stable, or resolving).
- The reported cerebral white matter volume and other regional brain volumes exclude the volume of lesions within these.
- It is critical that scanner protocol settings remain consistent between time points to ensure accurate detection of settle lesion changes.
- It is imperative that lesion settings remain consistent between time points. These settings will appear at the top of the report, right under the patient’s demographic information.
Other Suggestions to Ensure Accuracy
It is imperative to follow our recommended scanner protocols. The most common source of problems is the failure to follow the correct scan protocol. Find your correct parameters here.
LesionQuant is not intended for use with contrast agents.
Related Blogs
- Custom Lesion Segmentation
- LesionQuant Module’s Enriched Features: 3D T1 and FLAIR Reconstructed Images
- LesionQuant Processing Tips for Best Results
- Defining and Classifying FLAIR lesions in LesionQuant
Upgrading to 3.0 is available at no cost to online or installed customers who purchased after July 1, 2018. To learn more about LesionQuant and NeuroQuant 3.0 please watch our 3.0 release webinar or email info@cortechs.ai.
Share