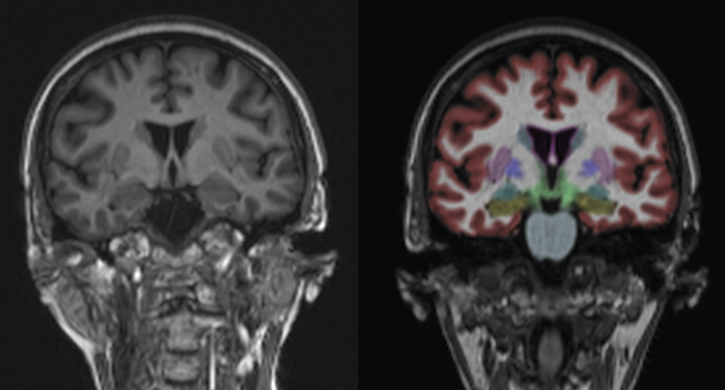
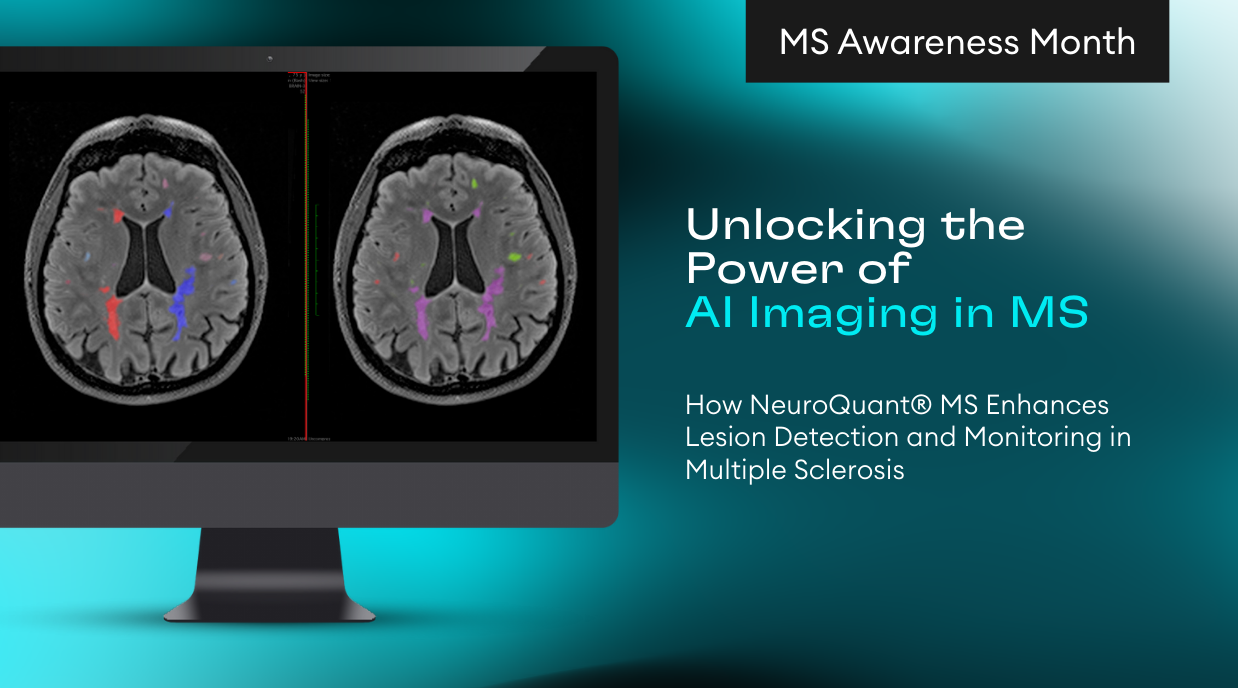
In addition to providing automated and fast brain structure segmentation, NeuroQuant produces color-coded overlays in which each color represents a different region of interest. The color-coding allows physicians to effortlessly review the segmentation. Also, for physicians wanting to examine a structure or structures that are not on the NeuroQuant output report, they can easily locate the structure by its associated color.
The images below show an MR T1-weighted images (left) and NeuroQuant segmentation overlaying a T1-weighted image (right). The table below the images provides the structure and associated color.
Segmented Color-Blended Volumes 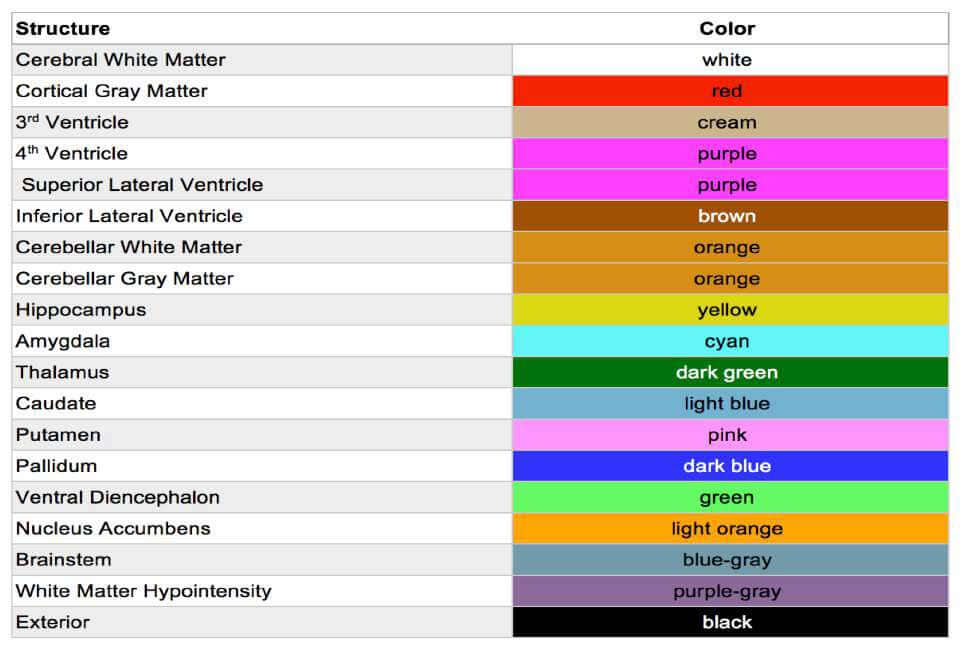
To learn more about the importance of using quantitative volumetric imaging for brain MRI in clinical practice, check out our latest Cortechs.ai white paper.
To see how you can use automated quantitative analysis to more objectively analyze your patients’ data, visit our website.
