Insight that leads to breakthrough discoveries
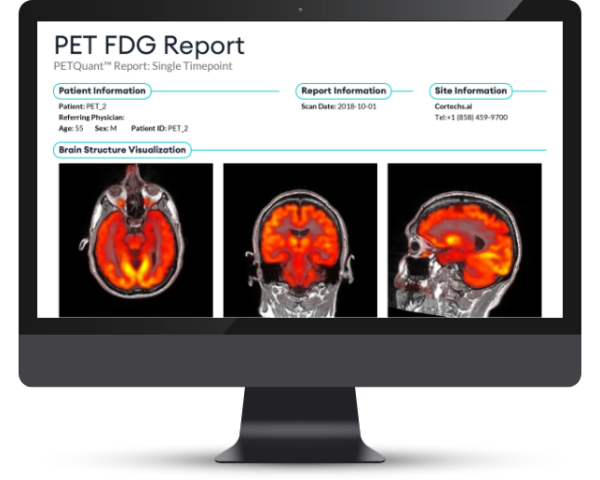
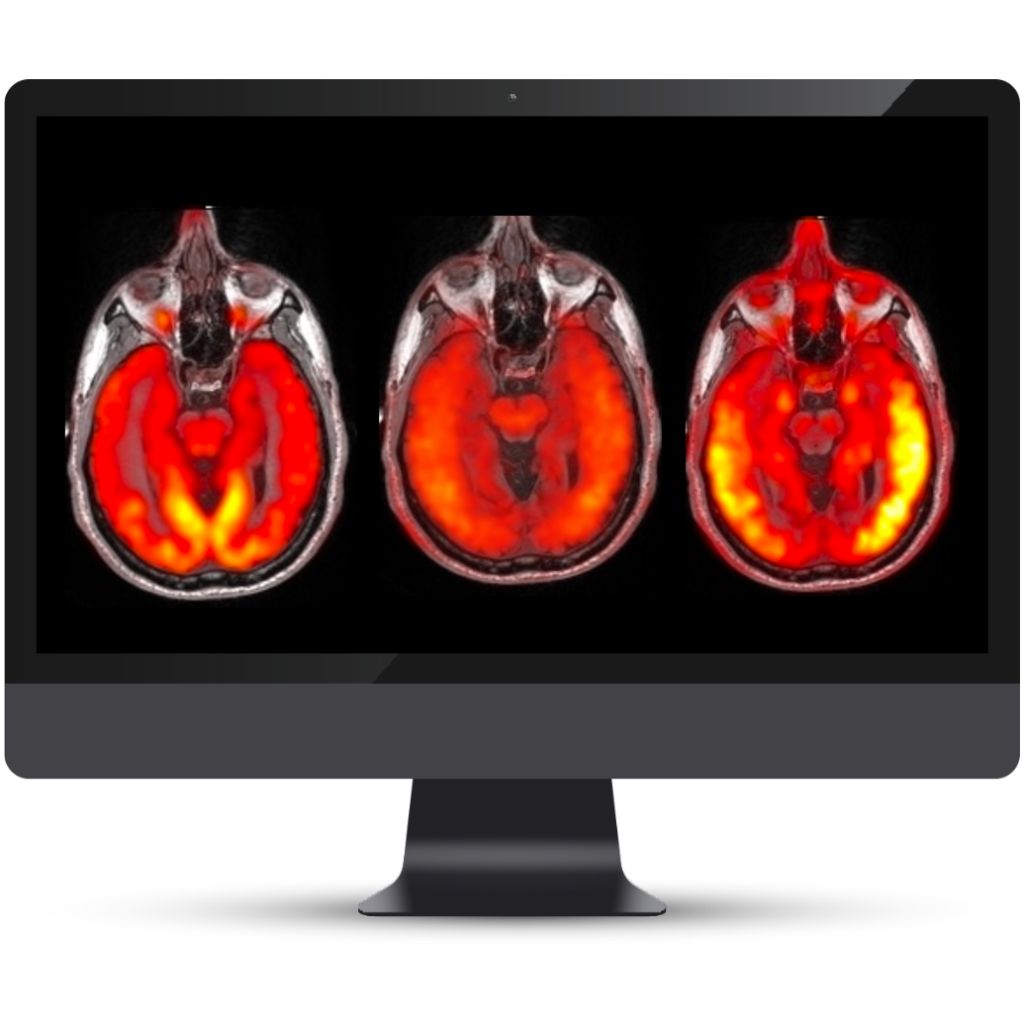
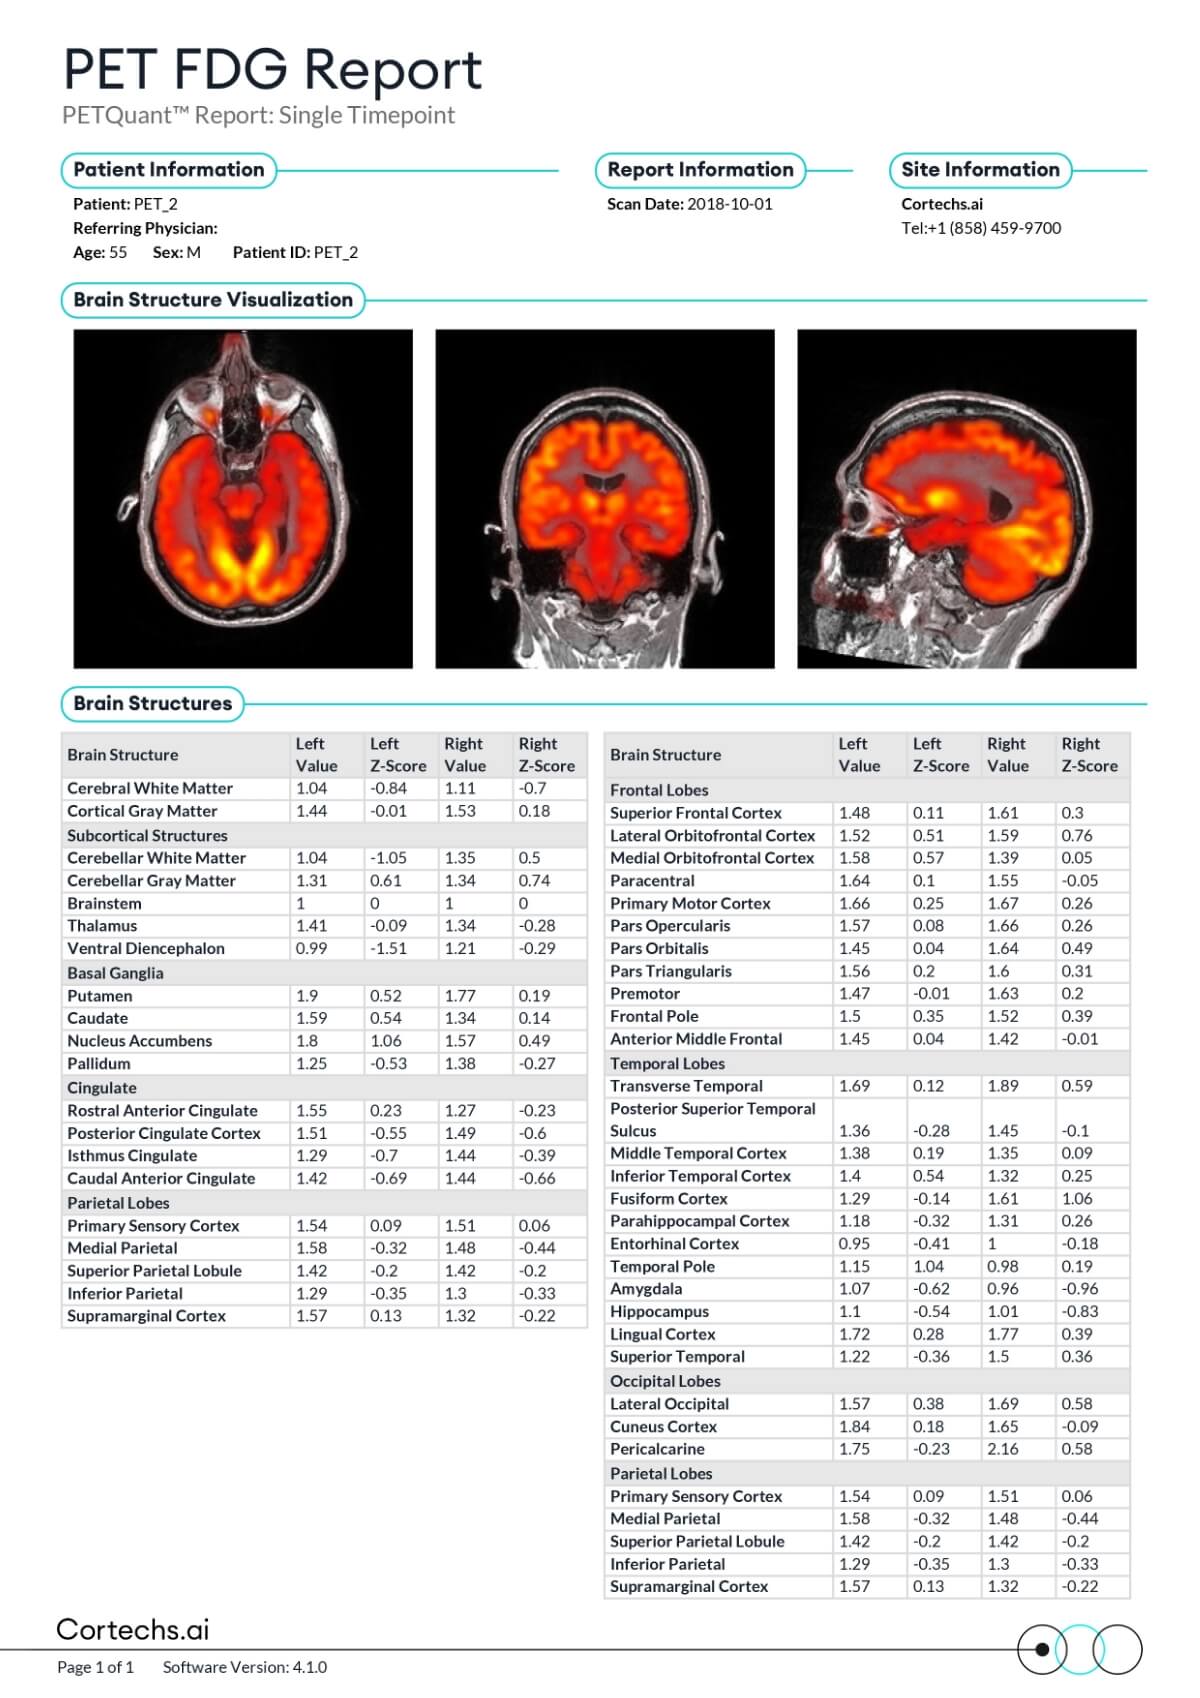
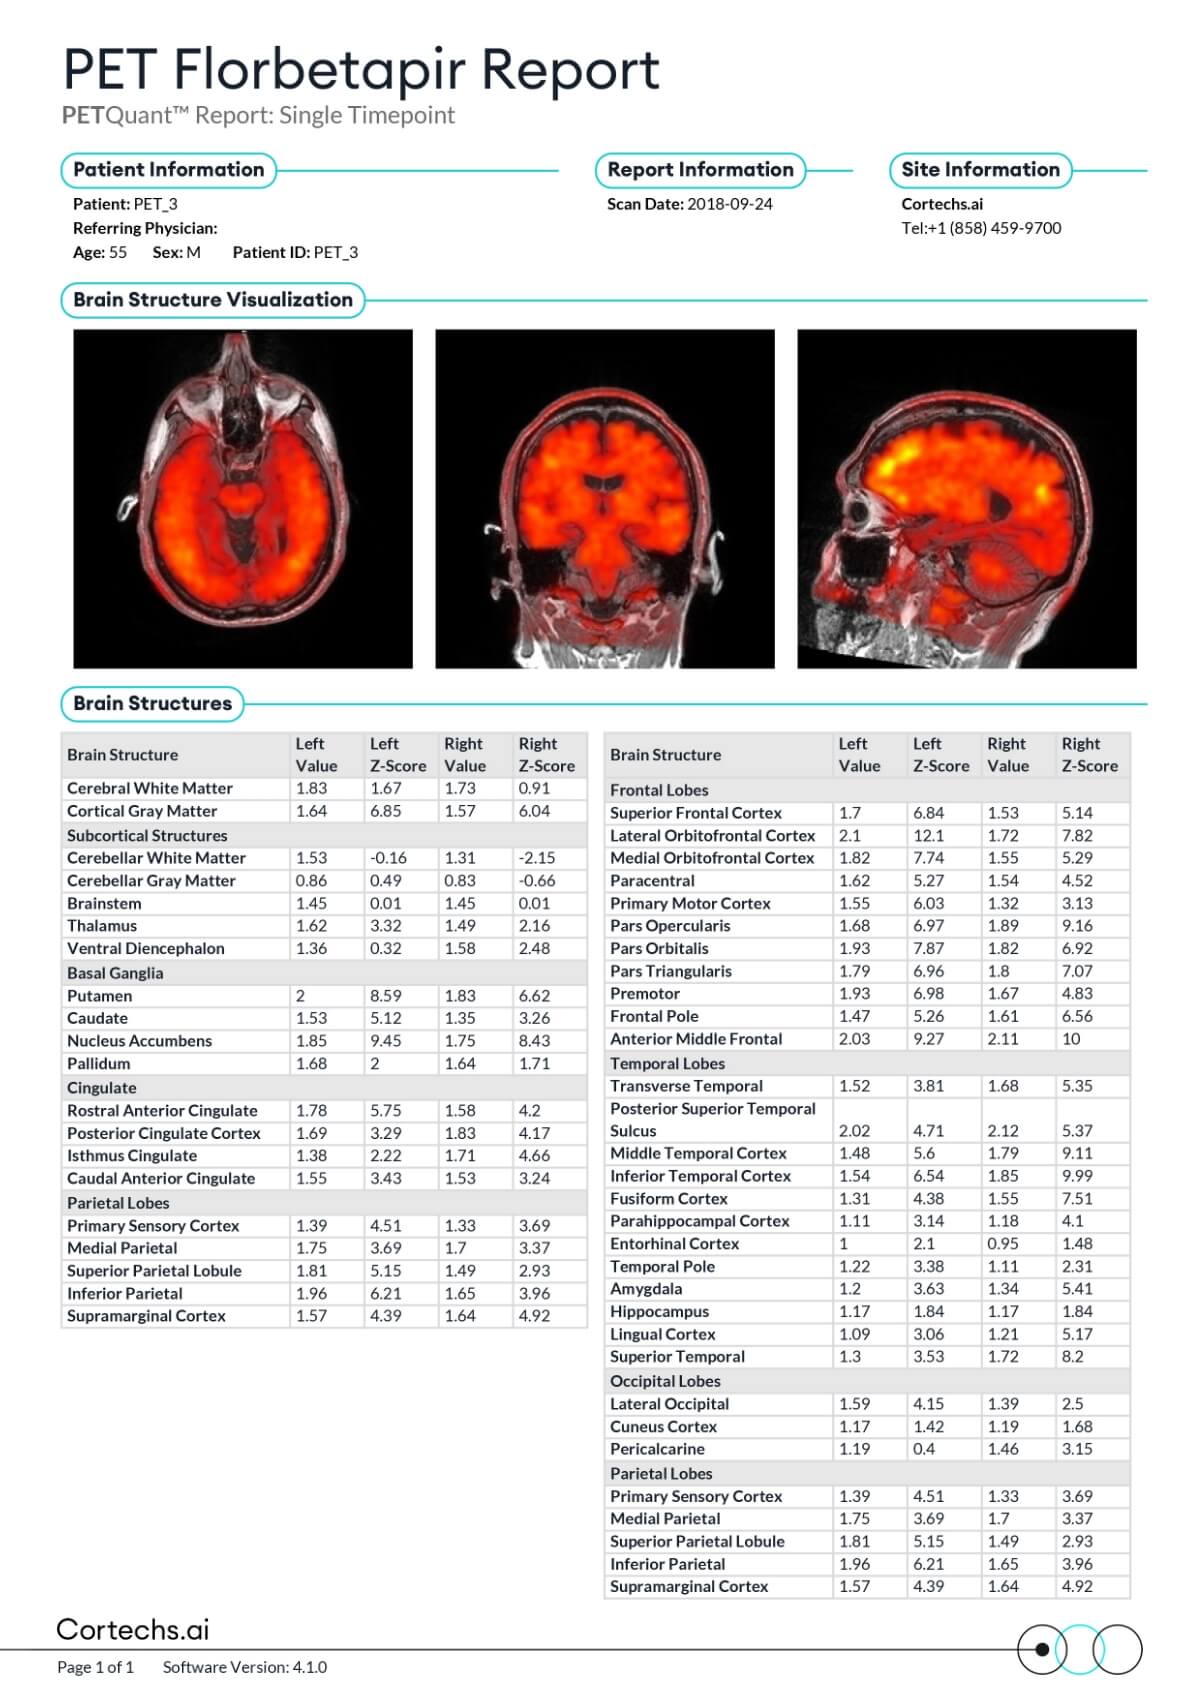
Automatically quantify PET tracer bindings localized to brain structures identified by NeuroQuant® 3D T1 MRI segmentation. Select between two tracers for metabolic (FDG) and amyloid-based (Florbetapir) analysis and compare visual and statistical (Z-score) comparisons of each normalized regional PET tracer value to normative population data.
Benefits
Reporting options
Choice of reports corresponding to PET tracer used
Clear visualization
Color-coded, graphical reports simplify quantitative reads
24/7 access
Secure access to Cortechs.ai’s secure, cloud-based system from virtually anywhere
NeuroQuant® PET reports
Powered by NeuroQuant® for trusted and proven brain segmentation analysis.


