- NeuroQuant® MS
Lesion detection, progression, and analysis for patients with multiple sclerosis
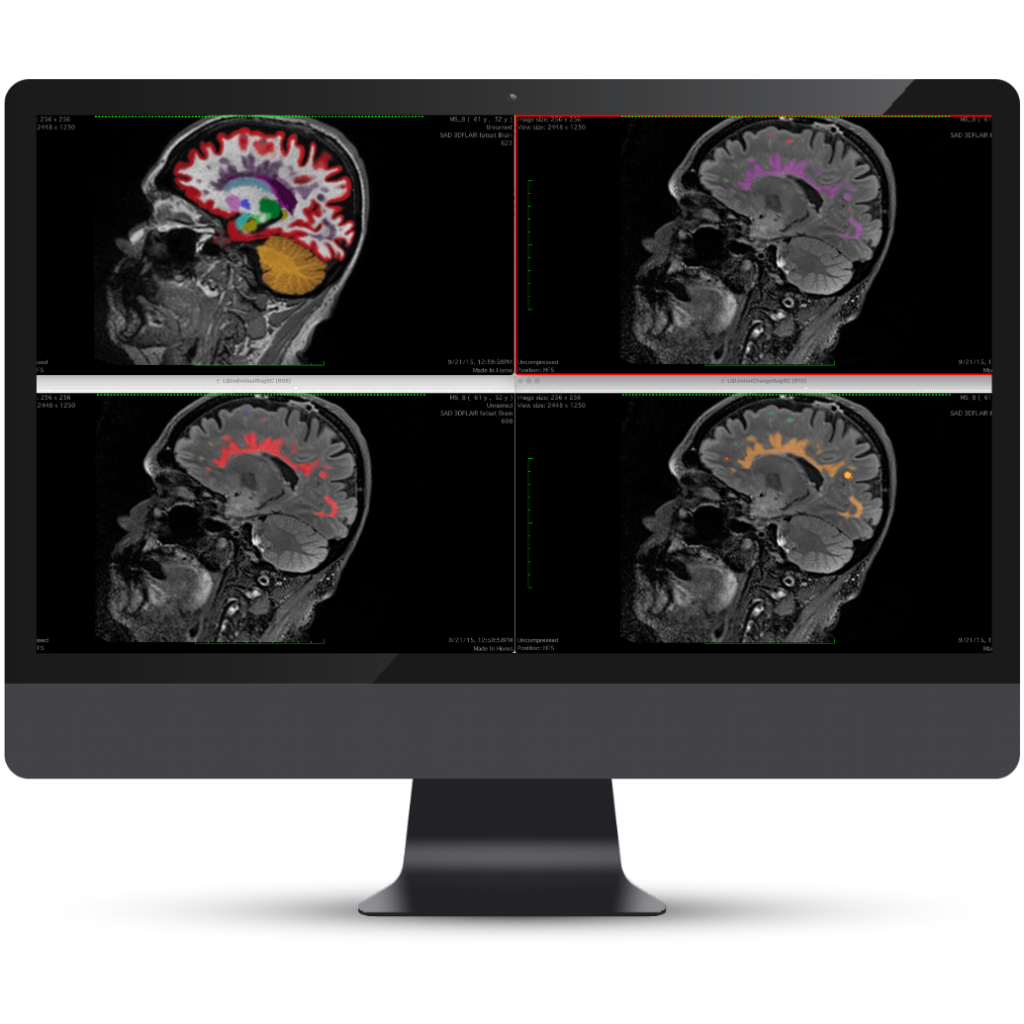
Enhance radiology workflows and output identifying, quantifying, and tracking multiple sclerosis lesions. NeuroQuant MS automatically labels and provides change visualization of new, stable, shrinking, enlarging, and other lesion dynamics.


Identify and track evolution of MS lesions over time
Supports clinical impression with objective, volumetric data and color-coded brain structure images that aid diagnosis, treatment and lifestyle planning. Identify lesion dissemination, analyze patterns of distribution, highlight areas of highest burden and track lesions across orthogonal views.
Benefits
Color-coded lesion segmentation
Identify confluent lesions and new lesion load
Track progression over time
Longitudinal reporting monitors structure volumes and visual changes from previous scans – all within a single report.
Change visualization
Color-coded overlay demonstrates lesion dynamics
Normative reference data
Compare the patient’s brain structure volume measurements to a normal population.
Accuracy across all ages
Analyse ages 3-100 using our Dynamic Atlas™ technology, validated over thousands of clinical cases.
NeuroQuant® MS reports
Precise quantitative measurements aid in clinical assessment, treatment planning, and disease progression monitoring.

