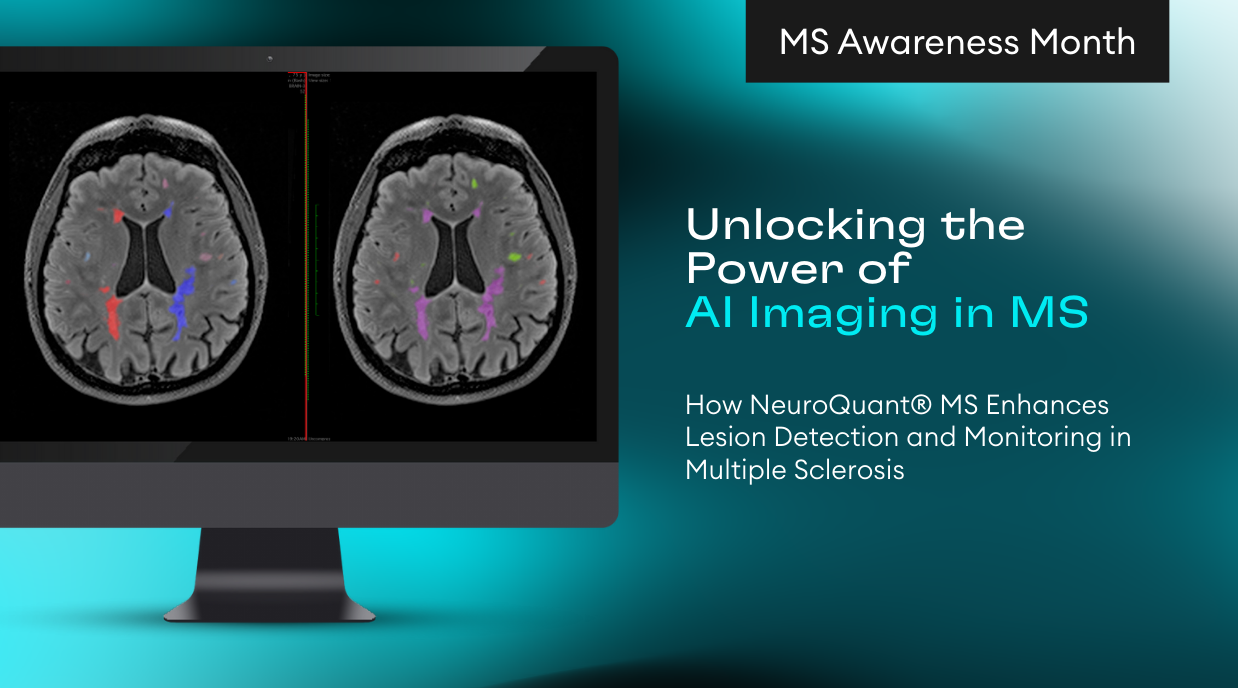
Automated volumetric MR imaging offers an opportunity to extend brain atrophy measurements to the routine management of Multiple Sclerosis (MS) patients by showing regional and whole brain atrophy, which can be monitored over time.
In MS patients, brain volume loss, specifically of the cerebral cortex and thalamus, has been correlated with disability progression and cognitive impairment. According to several studies, brain volume loss is an applicable measure of widespread central nervous system damage leading to clinical disease progression, and serves as a useful outcome in evaluating MS therapies.
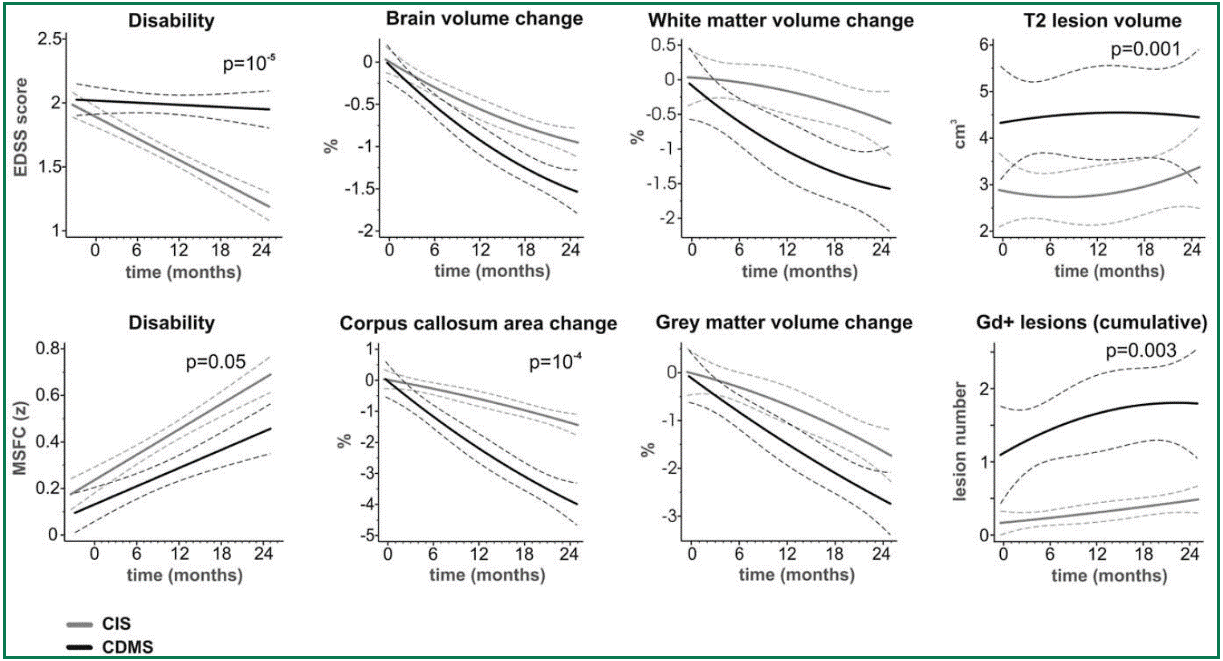
Early identification of patients with clinically isolated syndrome (CIS) at high risk of converting to definite MS is essential in providing timely and appropriate treatment. Volumetric MRI data provides measurements of the whole brain, gray and white matter volumes can potentially serve as biomarkers for this conversion and provide an assessment an individual’s risk of developing clinically definite MS. The figure below (source: Kalincik T, et al. 2012.Volumetric MRI Markers and Predictors of disease Activity in early Multiple Sclerosis: A Longitudinal Cohort Study.) shows disability and volumetric MRI parameters in patients with CIS and in those converting to MS, with the dashed lines displaying confidence intervals.
For physicians looking to evaluate MS with volumetric MR imaging, the NeuroQuant Multi Structure Atrophy report provides volume measurements for nine brain structures, including the whole brain, white and gray matter, lateral ventricle, thalamus, 3rd ventricle and hippocampus, as well as, T1 white matter hypointensities. Additionally, the NeuroQuant Multi Structure Atrophy report indicates the patient’s brain structure volume measurements as compared to a healthy population via Cortechs.ai’ norms. This allows NeuroQuant to deliver a precise indication of where that individual’s brain structure volumes lie within an age- and gender-based reference chart.
The NeuroQuant Multi Structure Atrophy report provides a multi time point feature, which can be used to assess volume changes in these brain structures by displaying the results of follow up measurements together with all previous measurements, providing physicians with additional information when monitoring MS and treatment effectiveness. This feature provides volume of brain structures at multiple time intervals, on the same report. Physicians can use this information to quickly and easily assess volume change and establish rate of change. The NeuroQuant Multi Structure Atrophy report delivers precise and critical information to aid physicians in the assessment of multiple sclerosis.
Radue, EW, et al. (2013). Brain Atrophy: An in-vivo Measure of Disease Activity in Multiple Sclerosis. Swiss Medical Weekly. 143: w13887.
Sormani MP, Arnold DL, De Stefano N. (2014). Treatment Effect on Brain Atrophy Correlates with Treatment Effect on Disability in Multiple Sclerosis. Ann Neurol. 75:43-49.
Kalincik T, et al. (2012). Volumetric MRI Markers and Predictors of disease Activity in early Multiple Sclerosis: A Longitudinal Cohort Study. PLoS ONE 7(11): e50101
